Characterization of Gold Deposits in Alta Floresta Gold Province Combining Geophysical Data and Deep Learning Algorithms
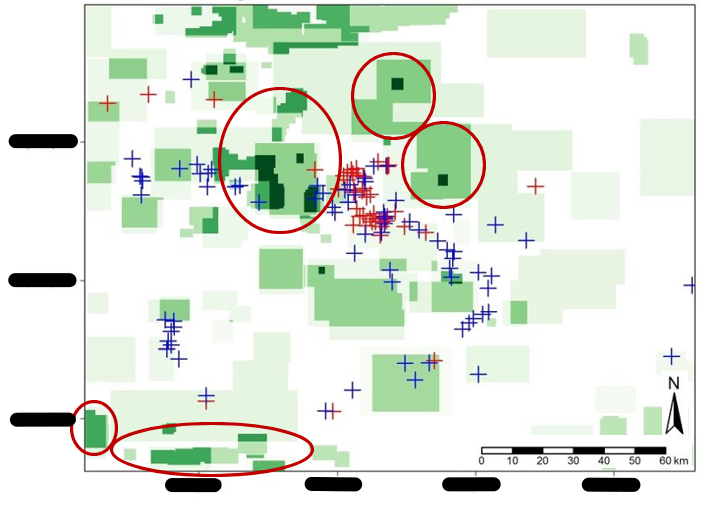
Prediction map of potential mineralization by hydrothermal process for the eastern portion of the PAAF. This map was produced by the algorithm that combines the Deep Learning models developed for gamma spectrometry data processing. The dark green regions indicate a higher probability of gold mineralization. The blue and red marks indicate mining locations (below the ground surface where gamma spectrometry data do not reach). The red circles indicates where exist irregular mining activities.
Topics, Skills and Tools Used
- Deep Learning.
- Gold deposits.
- Aerogeophysical data.
- Python.
- R.
This project was advised by Dr. Vinicius Louro.
Aim of the Project
The aim of this project is to produce indicators of potential gold mineralization resulting from of hydrothermal alteration processes. This objective was achieved by using Deep Learning to decrease data processing time. The identification was through the use of techniques to manipulate the gamma spectrometry data in order to help identify these processes. These techniques identified anomalous values of K, low values of Th/K ratio, and high values of factor F. The application of the model generated was in the Eastern portion of the Alta Floresta Gold Province which is located in the State of Mato Grosso, Brazil. This place is recognized for its potential auriferous. A secondary objective was to explore different Deep Learning algorithms, analysis, and quality control of results obtained in order to get the tools that best fit the problem and research settings.
Methods
Gamma spectrometry surveys quantify the emissions of electromagnetic radiation emitted by the decay of radioactive elements in a given region. Based on this, it is possible to obtain estimates of element concentrations (K, U, and Th) from airborne equipment (Kearey et al., 2002). K anomalies may indicate Cu-Au porphyries deposits and gold epithermal deposits as results of processes of sericitic or potassium alteration (Dickson and Scott. 1997). Maps produced with the ratio of Th/K and F factor (K*U/Th) provide a more precise indication of the places with hydrothermal alteration related to gold and copper mineralization (Ribeiro et al., 2014).
These gamma spectrometric data were used for training Deep Learning networks for the recognition of these signatures relevant to the identification of potential gold mineralization. Deep Learning is a sub-area of Machine Learning that use mathematical models created with the ability to make predictions or take decisions from data sets and without be explicitly programmed (Goodfellow et al., 2016). Deep Learning, therefore, does the recognition of the patterns present in the data through mathematical models based in artificial neural network (Goodfellow et al., 2016 and Schmidhuber, 2015). Supervised learning was used to train the network. This technique consists of the presentation of data to the algorithm with class tags for each data. These tags were created from public images obtained from the CPRM (Brazilian Geological Survey) geoscientific database. The neural network used for learning the data patterns and generation of models was the YOLOv5 network (Jocher, 2021). This one is able to classify images and characterize the limits of the class searched within the image.
Results
The trained models showed no evidence of overfitting. The application of these for validation in the test data presents satisfactory results. These models when tested in the test images identify almost all regions of interest.
The results obtained by the algorithm built from three Deep Learning models (K anomaly, low Th/K values and high F factor values) applied on the ternary gamma spectrometric map of the eastern portion of the Alta Floresta Gold Province are illustrated in the figure below. Data on gold mineral occurrences and mining locations obtained from the literature (Silva and Abram, 2008) it is possible to verify that regions indicated by the application of the algorithm on the region of interest (dark green regions on the map) are in line with information about garimpos (irregular mining activities) (red circles). The northern dark green region is a region with difficult accessibility and can be a place for further investigation.
Prediction map of potential mineralization by hydrothermal process for the eastern portion of the PAAF. This map was produced by the algorithm that combines the Deep Learning models developed for gamma spectrometry data processing. The dark green regions indicate a higher probability of gold mineralization. The blue and red marks indicate mining locations (below the ground surface where gamma spectrometry data do not reach). The red circles indicates where exist irregular mining activities.
Conclusion
As for any area of study in which Deep Learning techniques are intended to be applied, it is necessary to search for neural networks capable of adjusting and solving the necessary problem, without losing focus on the availability of resources and data for the realization of the project. In this way, the use of Deep Learning in the mining area needs a critical search for which algorithms to use according to these peculiarities.
The results obtained show that the use of Machine Learning can help in the interpretation of gamma spectrometry data and generate insights into remote regions. Added to this, the main advantage is the reduction of the time invested in the processing and delimitation of exploratory targets from geophysical aerial survey data. With this time reduction, it is possible to spend more time interpreting the results generated by the model through geological and geophysical knowledge.
References
Dickson, B.L., Scott, K.M., 1997. Interpretation of aerial gamma-ray surveys-adding the geochemical factors. AGSO Journal of Australian Geology and Geophysics, 17, 187- 200.
Goodfellow, I., Bengio, Y., Courville, A., 2016. Deep Learning. MIT Press, http://www.deeplearningbook.org (acessado em 07/09/2021).
Jocher, G., Stoken, A., Jirka Borovec, J., NanoCode012, ChristopherSTAN, Changyu, L., Yu, L., 2021. ultralytics/yolov5: v4.0 - nn.SiLU() activations, Weights & Biases logging, PyTorch Hub integration. Zenodo.
Kearey, P., Brooks, M., Hill, I., 2002. An Introduction to Geophysical Exploration. by Blackwell Science Ltd.
Ribeiro, V.B., Mantovani, M.S.M.; Louro, V.H.A., 2014. Aerogamaespectrometria e suas aplicações no mapeamento geológico. Terrae Didatica, 10, 29-51.
Schmidhuber, J., 2015. Deep learning in neural networks: An overview. Neural Networks, 61, 85-117.
Silva M.G. & Abram M.B. 2008. Projeto metalogenia da Província Aurífera Juruena- Teles Pires, Mato Grosso. Goiânia, Serviço Geológico Brasileiro, CPRM, 212p.